


Abstract
Thyroid cancer survivors are at high risk of developing multiple cardiac and vascular conditions as consequence of cancer diagnosis and treatment. However, it is still unclear how the baseline and prognostic factors, as well as cancer treatments, play a role in increasing cardiac and vascular disease risk among thyroid cancer survivors.
To investigate the association between potential risk factors, treatment effects, and cardiovascular disease (CVD) outcomes in thyroid cancer survivors.
Primary thyroid cancer survivors, diagnosed from 1997 to 2012 (n = 3822), were identified using the statewide Utah Population Database. The medical records were used to ascertain information on risk factors and CVD outcomes. Cox proportional hazards models were used to assess the risk of CVD with baseline demographic data and clinical factors.
Among thyroid cancer survivors, age and year at cancer diagnosis, cancer stage, sex, baseline body mass index, baseline comorbidities, and TSH suppression therapy were significantly associated with CVD risk 1 to 5 years after cancer diagnosis. Patients who were male, overweight or obese, older at cancer diagnosis, and diagnosed with cancer since 2005 had an increased risk of CVD compared with patients who were female, had a normal body mass index, were younger at cancer diagnosis, and diagnosed with cancer from 1997 to 1999. Administration of TSH suppression therapy, distant metastases at cancer diagnosis, and a higher Charlson comorbidity index score were associated with an increased CVD risk among thyroid cancer survivors.
Our findings suggest that examining the effect of thyroid cancer diagnosis, cancer treatment, and demographic characteristics on the risk of CVD is critical.
Thyroid cancer is the eighth most common cancer in the United States, with an estimated 64,300 new cases diagnosed in 2016 (1). In the United States, Utah has the third highest incidence rate of thyroid cancer at 19.03 per 100,000 population (2). The 5-year survival rate of thyroid cancer was 98.1% from 2006 to 2012 (1). However, with the increasing trend of new cases, thyroid cancer is expected to surpass other cancers and become the fourth most common cancer in the United States by 2030 (3).
The primary treatment of patients with thyroid cancer is surgery, either total or partial thyroidectomy, with most undergoing total thyroidectomy (86%) (4). Among the patients with papillary or follicular thyroid cancer who received surgery, nearly one-half of them additionally receive radioactive iodine (RAI) to treat either residual cancer or ablate the remnant thyroid tissue (4). Although chemotherapy is rarely prescribed for patients with thyroid cancer, except when metastasis is present, TSH suppression therapy or TSH replacement therapy is often used to further reduce the risk of recurrence in select cases (4, 5).
Given that patients with thyroid cancer are relatively younger at diagnosis with a higher rate of survival, it is important to study the long-term effects of cancer treatment and evaluate the quality of life of thyroid cancer survivors with a near-normal life expectancy (6–8). According to results from previous studies and guidelines, RAI is associated with an increased risk of cardiovascular diseases (CVDs), and prolonged thyroxine exposure or TSH suppressive therapy increases the risk of large artery impairment and small arterial stiffness (which has been accepted as a CVD surrogate marker), hypertension, cardiac arrhythmias, and cardiovascular-specific mortality (5, 9–18).
Recently, we reported a study, in which we examined the risks of circulatory health conditions after thyroid cancer diagnosis compared with cancer-free individuals (19). In that study, we found that thyroid cancer survivors have an increased risk of several circulatory conditions compared with the matched cancer-free population, and these were significantly elevated with an older age at cancer diagnosis, male sex, obesity, and higher Charlson comorbidity index (CCI) (19). In an attempt to further address these associations and better understand how the baseline and prognostic factors, as well as cancer treatments, play a role in increasing cardiac and vascular disease risk among thyroid cancer survivors, we assessed the risk factors for CVD among thyroid cancer survivors in the state of Utah.
Materials and Methods
Study population
The study cohort was developed within the Utah population database (UPDB), a database using data from the Utah Cancer Registry (one of the original nine cancer registries from National Cancer Institute Surveillance, Epidemiology, and End Results program), electronic medical records (EMRs), and vital records from the Utah Department of Health. The EMR data include statewide inpatient discharge and ambulatory surgery data and data from University of Utah Health and Intermountain Healthcare (20). Among the study population, ~97% had at least one medical record among the listed health care data sources, 85.6% had statewide hospital discharge/ambulatory surgery data, and 90.4% had EMR data from University of Utah Health and/or Intermountain Healthcare. The University of Utah institutional review board approved the present study.
We used the Utah Cancer Registry records to identify primary thyroid cancer cases diagnosed from 1997 to 2012 and linked treatment data. The last follow-up date was identified by UPDB via various data sources, which included vital records from the Utah Department of Health, voter registration, driver’s license division, Utah Cancer Registry records, and Social Security Death Index (nationwide). We excluded patients with thyroid cancer if they had had a papillary micro-cancer (n = 18) or had missing or unknown information on cancer stage (n = 101). Patients were also excluded if they had not been living in Utah at the time of the diagnosis (n = 128) or if their follow-up time from the cancer diagnosis was <1 year (n = 243).
Exposure and outcome of interest
The demographic and clinical data included sex, birth year, age at thyroid cancer diagnosis, race/ethnicity, body mass index (BMI), year of cancer diagnosis, cancer stage, cancer histologic type, number of cancers, cancer treatment, TSH suppression therapy, and CCI score (21). The CCI score was calculated using all medical record data before the date of the thyroid cancer diagnosis and used as a measure of baseline health. We used a modified CCI score calculation for our analysis. Instead of including only a few diagnoses categorized within CVD such as myocardial infarction, peripheral vascular disease, congestive heart failure, and cerebrovascular disease, we included all CVD-related diagnoses under investigation in our study for the CCI score calculation. In addition, two of the variables used to calculate the score were excluded (any malignancy and metastatic solid tumor) to avoid double adjustment for cancer (21).
We used the Clinical Classification Software (CCS) for the International Classification of Diseases, Ninth Revision, Clinical Modification (ICD-9-CM), created by the Healthcare Cost and Utilization Project, to identify CVD outcomes (22). The CCS is a system that categorizes patient diagnoses and procedures using ICD-9-CM codes. The CCS categories consist of four levels, from the broad category (level 1) to more detailed grouping (level 4) according to clinical meaningfulness (22). CVD and five specific cardiovascular categories (hypertension, heart disease, cerebrovascular disease, diseases of the arteries, arterioles, and capillaries, and diseases of the veins and lymphatics) were assessed. If multiple CVD outcomes were diagnosed after the cancer diagnosis, we used the first primary CVD case as an individual’s main outcome. The CVD diagnoses were stratified over three periods: 1 to 5, >5 to 10, and ≥10 years after the cancer diagnosis.
Statistical analysis
The characteristics of thyroid cancer survivors stratified by the CVD diagnosis were summarized using descriptive statistics. Cox proportional hazards models were used to calculate the hazard ratios (HRs) and 95% CIs and to estimate the effect of each risk factor on the development of CVD. The time-to-event was defined as the time from the thyroid cancer diagnosis to the CVD diagnosis or to their last date known to be alive and residing in Utah. If the proportional hazard assumption was violated in the Cox model, we used Cox models with cubic splines to identify nonlinear covariate response relationships in the Cox model and perform a flexible assessment of the time-by-covariate interactions (23–25).
The BMI at least 1 year before the thyroid cancer diagnosis was used as the baseline BMI. Given that ~20% of all participants had missing BMI data at baseline, we used iterative chained equation imputation, which is a multiple imputation approach to provide missing BMI data (26). We assessed whether the BMI was missing at random using the logistic regression model (1 = missing BMI vs 0 = not missing BMI). In this regression, we controlled for CVD (i.e., outcome), age at diagnosis, sex, race, and CCI to assess whether the probability of the missing BMI depended on the observed covariates and outcome. Although we observed no differences in missing BMI data associated with sex, race, and CCI, we did find a difference in the distribution of mean age at cancer diagnosis between the missing values and the observed values. Thus, we imputed BMI for those with missing BMI data at random and adjusted all HR estimation models for age at diagnosis, sex, race, and CCI with fully conditional specification methods. To ensure that our inferences were not biased by the imputed BMI, we compared Cox regression models estimating HRs with only those with BMI available in the data vs with the full population after imputing the BMI for those with missing BMI at random.
We determined the potential confounding factors using directed acyclic graphs (27) and a review of previous reported data to assess whether the covariates met three properties of a confounder both clinically and statistically. Sex, race, age at diagnosis, cancer diagnosis year, cancer stage, BMI at baseline, and baseline CCI score were included in the multivariable adjusted models. The HRs were estimated separately for each risk factor after adjusting for confounding potentially associated with that specific risk factor. SAS software, version 9.4 (SAS Institute, Inc., Cary, NC) and Stata software, version 14.1 (StataCorp, College Station, TX) were used for all statistical analyses.
Results
Of the 3822 thyroid cancer survivors, 3510 (91.8%) had a diagnosis of papillary carcinoma (Tables 1 and 2). The cohort was predominantly white (96.1%) and female (78.8%). Nearly all had received surgically based treatment (thyroidectomy and thyroid lobectomy; 99.3%) and more than one- half (52.6%) had received postoperative adjuvant RAI treatment. A total of 1719 patients (45.0%) developed at least one cardiac or vascular disease 1 to 5 years after their cancer diagnosis. The mean ± SD follow-up time was 8.4 ± 4.1 years for the CVD group and 8.8 ± 4.5 years for the non-CVD group.
Baseline Characteristics of Thyroid Cancer Survivors Stratified by CVD Diagnosis 1 to 5 Years After Cancer Diagnosis (N = 3822)
| Characteristic | Total (N = 3822) | CVD 1–5 Y After Cancer Diagnosis | ||
|---|---|---|---|---|
| Yes (n = 1719) | No (n = 2103) | P Value | ||
| Follow-up period, y | <0.0001 | |||
| 1–5 | 943 (24.7) | 403 (23.4) | 540 (25.7) | |
| >5–10 | 1546 (40.5) | 768 (44.7) | 778 (37.0) | |
| >10–15 | 919 (24.1) | 395 (23.0) | 524 (24.9) | |
| >15 | 414 (10.8) | 153 (8.9) | 261 (12.4) | |
| Birth y | < 0.0001 | |||
| 1906–1960 | 1760 (46.1) | 1123 (65.3) | 637 (30.3) | |
| 1960–1969 | 850 (22.2) | 307 (17.9) | 543 (25.8) | |
| 1970–1979 | 834 (21.8) | 220 (12.8) | 614 (29.2) | |
| 1980–1994 | 378 (9.9) | 69 (4.0) | 309 (14.7) | |
| Diagnosis y | <0.0001 | |||
| 1997–1999 | 372 (9.7) | 159 (9.3) | 213 (10.1) | |
| 2000–2004 | 906 (23.7) | 382 (22.2) | 524 (24.9) | |
| 2005–2009 | 1419 (37.1) | 709 (41.2) | 710 (33.8) | |
| 2010–2012 | 1125 (29.4) | 469 (27.3) | 656 (31.2) | |
| Age at diagnosis, y | <0.0001 | |||
| 18–40 | 1516 (39.7) | 378 (22.0) | 1138 (54.1) | |
| 40–65 | 1618 (42.3) | 804 (46.8) | 814 (38.7) | |
| ≥65 | 688 (18.0) | 537 (31.2) | 151 (7.2) | |
| Sex | <0.0001 | |||
| Female | 3006 (78.7) | 1278 (74.4) | 1728 (82.2) | |
| Male | 816 (21.4) | 441 (25.7) | 375 (17.8) | |
| Race | 0.40 | |||
| Nonwhite | 149 (3.9) | 62 (3.6) | 87 (4.1) | |
| White | 3669 (96.1) | 1655 (96.4) | 2014 (95.9) | |
| Missing | 4 (0.10) | 2 (0.11) | 2 (0.048) | |
| Vital status | <0.0001 | |||
| Dead | 252 (6.6) | 196 (11.4) | 56 (2.7) | |
| Alive | 3570 (93.4) | 1523 (88.6) | 2047 (97.3) | |
| BMI at baseline, kg/m2 | <0.0001 | |||
| <18 | 68 (1.8) | 21 (1.2) | 47 (2.2) | |
| 18–24.9 | 1929 (50.5) | 674 (39.2) | 1255 (59.7) | |
| 25–29.9 | 1145 (30.0) | 609 (35.4) | 536 (25.5) | |
| ≥30 | 680 (17.8) | 415 (24.1) | 265 (12.6) | |
Data presented as n (%).
Clinical Characteristics of Thyroid Cancer Survivors Stratified by CVD Diagnosis 1 to 5 Years After Cancer Diagnosis (N = 3822)
| Characteristic | Total (N = 3822) | CVD 1-5 Y After Cancer Diagnosis | ||
|---|---|---|---|---|
| Yes (n = 1719) | No (n = 2103) | P Value | ||
| Histologic type | 0.43 | |||
| Papillary carcinoma | 3510 (91.8) | 1564 (91.0) | 1946 (92.5) | |
| Anaplastic carcinoma | 6 (0.2) | 4 (0.2) | 2 (0.1) | |
| Follicular carcinoma | 240 (6.3) | 118 (6.9) | 122 (5.8) | |
| Medullary carcinoma | 49 (1.3) | 24 (1.4) | 25 (1.2) | |
| Other | 17 (0.4) | 9 (0.5) | 8 (0.4) | |
| Treatment | 0.40 | |||
| Surgery only | 1790 (46.8) | 809 (47.1) | 981 (46.7) | |
| Surgery and radiation | 2006 (52.5) | 895 (52.1) | 1111 (52.8) | |
| Other | 26 (0.7) | 15 (0.9) | 11 (0.5) | |
| TSH suppression therapy | 0.002 | |||
| No | 2881 (75.4) | 1254 (73.0) | 1627 (77.4) | |
| Yes | 941 (24.6) | 465 (27.0) | 476 (22.6) | |
| CCI score at baseline | < 0.0001 | |||
| 0 | 1543 (40.4) | 247 (14.4) | 1296 (61.6) | |
| ≥1 | 2279 (59.6) | 1472 (85.6) | 807 (38.4) | |
| No. of cancers | 0.17 | |||
| 1 | 3456 (90.4) | 1542 (89.7) | 1914 (91.0) | |
| ≥2 | 366 (9.6) | 177 (10.3) | 189 (9.0) | |
Data presented as n (%).
The proportion of patients who died was significantly greater among the patients with a diagnosis of CVD compared with patients without a CVD diagnosis [196 (11.4%) and 56 (2.7%), respectively; P < 0.001] in the 1 to 5 years after the cancer diagnosis. Although most cancer survivors who did not have a CVD diagnosis had no baseline comorbidities [1296 (61.6%)], patients with a CVD diagnosis were more likely to be elderly, male, and overweight or obese compared with those who without a CVD diagnosis. No noticeable differences were found between the patients with and without CVD in the clinical cancer characteristics.
The risk of CVD was high among the patients with a diagnosis from 2005 to 2009 and 2010 to 2012 compared with those with a diagnosis from 1997 to 1999 (HR, 1.42; 95% CI, 1.19 to 1.69 and HR, 1.26; 95% CI, 1.05 to 1.51, respectively; Fig. 1). Patients aged 40 to 65 and >65 years at diagnosis had significantly increased risks for the CVD (HR, 1.66; 95% CI, 1.46 to 1.88 and HR, 2.84; 95% CI, 2.46 to 3.27, respectively) compared with those aged <40 years at cancer diagnosis. The risk of developing CVD was significantly greater for men compared with women (HR, 1.46; 95% CI, 1.31 to 1.62) and was greater for patients who received TSH suppression therapy compared with those who did not (HR, 1.25; 95% CI, 1.12 to 1.40). Overweight (BMI, 25 to 29.9 kg/m2) and obesity (BMI, ≥30 kg/m2) were factors significantly associated with an increased CVD risk (HR, 1.24; 95% CI, 1.11 to 1.39 and HR, 1.41; 95% CI, 1.25 to 1.60). Patients with any comorbidity had more than a fourfold increased risk of developing CVD compared with those with no comorbid conditions (HR, 4.47; 95% CI, 3.87 to 5.15). The presence of distant metastases of cancer was significantly associated with an elevated CVD risk compared with a localized cancer stage (HR, 1.35; 95% CI, 1.03 to 1.77). The risk factors for developing CVD within >5 to 10 years and >10 years were additionally assessed and summarized in Supplemental Table 1.
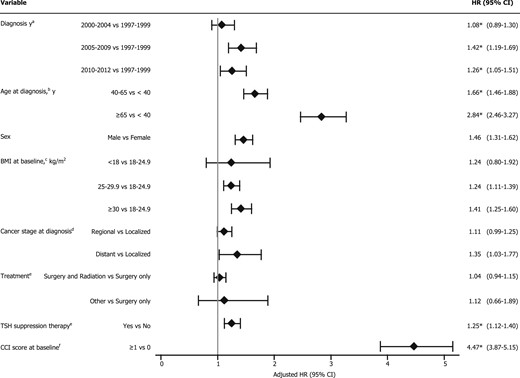
Potential risk factors for CVD among thyroid cancer survivors, 1 to 5 y after cancer diagnosis. *For the models that violated proportional hazards assumptions, we used Cox models with cubic splines. aAdjusted for age at diagnosis, BMI at baseline, and CCI score. bAdjusted for diagnosis year, race, sex, BMI at baseline, and CCI score. cAdjusted for diagnosis year, age at diagnosis, race, sex, and CCI score. dAdjusted for diagnosis year, age at diagnosis, race, sex, BMI at baseline, and CCI score. eAdjusted for diagnosis year, age at diagnosis, race, sex, BMI at baseline, cancer stage at diagnosis, and CCI score. fAdjusted for diagnosis year, age at diagnosis, race, sex, and BMI at baseline.
Multivariable adjusted HRs for the baseline covariates and clinical predictors associated with CVD subgroup in the 1- to 5-year period are summarized in Tables 3 and 4, respectively. Overall, a diagnosis of cancer at an older age was significantly associated with elevated risks for multiple circulatory conditions. Thyroid cancer survivors with a diagnosis at an age from 40 to 65 years and >65 showed a significantly increased risk of multiple cardiac and vascular conditions compared with those with a diagnosis at an age <40 years after adjusting for confounders. Furthermore, compared with female thyroid cancer survivors, male thyroid cancer survivors were more likely to have multiple CVD conditions. Individuals with an overweight baseline BMI only had an elevated risk of hypertension, heart disease, and diseases of the arteries, arterioles, and capillaries. In contrast, obesity was associated with an increased risk of all disease subtypes classified under CVD, except for cerebrovascular disease (Table 3). The risk factors for the CVD subgroups of >5- to 10-year and >10-year periods are summarized in Supplemental Table 2 and Table 3.
Baseline Risk Factors For CVD Subgroup, 1 to 5 Years After Cancer Diagnosis Among Thyroid Cancer Survivors (N = 3822)
| Variable | CVD Subgroup | ||||
|---|---|---|---|---|---|
| Hypertension (n = 1075) | Heart Disease (n = 968) | Cerebrovascular Disease (n = 125) | Diseases of Arteries, Arterioles, and Capillaries (n = 479) | Diseases of Veins and Lymphatics (n = 531) | |
| Diagnosis ya | |||||
| 1997–1999 | Reference | Reference | Reference | Reference | Reference |
| 2000–2004 | 1.12b (0.87-1.42) | 1.02b (0.80-1.30) | 1.57b (0.64-3.87) | 1.77b (1.14-2.75) | 2.00b (1.35-2.97) |
| 2005–2009 | 1.57b (1.25-1.97) | 1.17b (0.93-1.47) | 2.49b (1.07-5.76) | 2.15b (1.42-3.26) | 2.28b (1.56-3.34) |
| 2010–2012 | 1.33b (1.05-1.68) | 1.15b (0.91-1.46) | 2.29b (0.97-5.45) | 2.59b (1.70-3.96) | 1.89b (1.27-2.81) |
| Age at diagnosis,c y | |||||
| <40 | Reference | Reference | Reference | Reference | Reference |
| 40–65 | 2.22b (1.84-2.68) | 1.31b (1.10-1.56) | 2.92b (1.45-5.87) | 1.34b (1.03-1.73) | 1.91b (1.49-2.44) |
| ≥65 | 4.29b (3.52-5.24) | 2.53b (2.10-3.04) | 7.75b (3.85-15.60) | 2.72b (2.08-3.55) | 2.23b (1.70-2.92) |
| Sex | |||||
| Female | Reference | Reference | Reference | Reference | Reference |
| Male | 1.84 (1.61-2.09) | 1.43 (1.24-1.65) | 2.00 (1.38-2.89) | 1.62 (1.33-1.97) | 1.37 (1.13-1.66) |
| BMI at baseline,d kg/m2 | |||||
| <18 | 0.91 (0.40-2.04) | 1.30 (0.73-2.31) | 1.46 (0.20-10.75) | 1.25 (0.51-3.06) | 1.25 (0.51-3.06) |
| 18–24.9 | Reference | Reference | Reference | Reference | Reference |
| 25–29.9 | 1.55 (1.34-1.80) | 1.20 (1.03-1.40) | 1.27 (0.83-1.94) | 1.25 (1.01-1.55) | 0.91 (0.73-1.12) |
| ≥30 | 1.97 (1.68-2.30) | 1.53 (1.30-1.80) | 1.07 (0.66-1.74) | 1.33 (1.05-1.69) | 1.30 (1.05-1.61) |
Data presented as HR (95% CI).
Adjusted for age at diagnosis, BMI at baseline, and CCI score.
For the models that violated proportional hazards assumptions, we used Cox models with cubic splines.
Adjusted for diagnosis y, race, sex, BMI at baseline, and CCI score.
Adjusted for diagnosis y, age at diagnosis, race, sex, and CCI score.
Clinical Risk Factors For CVD Subgroup 1 to 5 Years After Cancer Diagnosis Among Thyroid Cancer Survivors (N = 3822)
| Variable | CVD Subgroup | ||||
|---|---|---|---|---|---|
| Hypertension (n = 1075) | Heart Disease (n = 968) | Cerebrovascular Disease (n = 125) | Diseases of Arteries, Arterioles, and Capillaries (n = 479) | Diseases of Veins and Lymphatics (n = 531) | |
| Cancer stage at diagnosisa | |||||
| Localized | Reference | Reference | Reference | Reference | Reference |
| Regional | 1.07 (0.92–1.23) | 0.97 (0.83–1.13) | 0.91 (0.59–1.42) | 1.07 (0.86–1.33) | 1.05 (0.86–1.29) |
| Distant | 1.32 (0.96–1.81) | 1.33 (0.95–1.87) | 0.45 (0.11–1.83) | 1.58 (1.01–2.46) | 1.24 (0.76–2.02) |
| Treatmentb | |||||
| Surgery only | Reference | Reference | Reference | Reference | Reference |
| Surgery and radiation | 0.99 (0.87–1.13) | 1.03 (0.90–1.18) | 1.44 (0.99–2.09) | 1.02 (0.84–1.24) | 0.98 (0.82–1.17) |
| Other | 0.66 (0.32–1.36) | 1.38 (0.99–1.92) | 1.38 (0.19–10.21) | 0.64 (0.20–2.06) | 0.99 (0.36–2.69) |
| TSH suppression therapyb | |||||
| No | Reference | Reference | Reference | Reference | Reference |
| Yes | 1.22c (1.06–1.41) | 1.13c (0.98–1.32) | 0.89c (0.58–1.35) | 1.27c (1.04–1.56) | 1.12c (0.91–1.36) |
| CCI score at baselined | |||||
| 0 | Reference | Reference | Reference | Reference | Reference |
| ≥1 | 6.78c (5.33–8.61) | 3.37c (2.78–4.08) | 4.48c (2.21–9.10) | 3.87c (2.87–5.20) | 7.45c (5.30–10.48) |
Data presented as HR (95% CI).
Adjusted for diagnosis y, age at diagnosis, race, sex, BMI at baseline, and CCI score.
Adjusted for diagnosis y, age at diagnosis, race, sex, BMI at baseline, cancer stage at diagnosis, and CCI score.
For the models that violated proportional hazards assumptions, we used Cox models with cubic splines.
Adjusted for diagnosis y, age at diagnosis, race, sex, and BMI at baseline.
The adjusted HRs for the thyroid cancer survivors who had received TSH suppression therapy were significantly greater for hypertension and diseases of the arteries, arterioles, and capillaries (HR, 1.22; 95% CI, 1.06 to 1.41 and HR, 1.27; 95% CI, 1.04 to 1.56, respectively) compared with those who had not received TSH suppression therapy. Although the difference was not statistically significant, the use of radiation therapy after surgery was marginally associated with an increased risk of cerebrovascular disease compared with those who had received surgery only (Table 4). When stratifying the effect of different types of postoperative radiation therapy (beam radiation, radioactive implants, and RAI) on the development of CVD, although only marginally significant statistically, the use of RAI after surgery was positively associated with the risk of developing cerebrovascular disease (HR, 1.42; 95% CI, 0.97 to 2.07; P = 0.07; data not shown) Patients with distant metastases of cancer had a 58% greater risk of developing diseases of the arteries, arterioles, and capillaries compared with the patients with localized thyroid cancer (HR, 1.58; 95% CI, 1.01 to 2.46). Also, a significantly elevated risk was found for all 5 CVD subgroups among the patients with any vs without any pre-existing comorbidities.
In a sensitivity analysis comparing the estimated HRs of the covariates with only the not missing BMI data included with the estimated HRs of the covariates with the imputed BMI included, we found slight changes in the HRs after the imputation. Among the risk factors for overall CVD, we found that the estimates for cancer stage and year at diagnosis have a changed inference owing to the imputed BMI values. In patients with distant metastases of cancer, the HR was 1.28 (95% CI, 0.95 to 1.73) without imputation vs 1.35 (95% CI, 1.03 to 1.77) with imputation. In patients with a diagnosis from 2005 to 2009 and 2010 to 2012, the HRs without vs with imputation were 1.27 (95% CI, 0.96 to 1.69) vs 1.42 (95% CI, 1.19 to 1.69) and 1.10 (95% CI, 0.83 to 1.47) vs 1.26 (95% CI, 1.05 to 1.51), respectively. However, we did not observe any notable variation in the overall trends for HRs after the multiple imputation of the BMI missing values.
Discussion
In a statewide sample of primary thyroid cancer cases followed up for >15 years, we found that patient age and year of cancer diagnosis, cancer stage, sex, baseline BMI and CCI score, and the use of TSH suppression therapy were significantly associated with an elevated CVD risk within 1 to 5 years after the thyroid cancer diagnosis. Radiation therapy after surgery was marginally associated with an elevated risk of cerebrovascular disease compared with surgery only. Additionally, our findings of increased risks of diseases of the circulatory system among thyroid cancer survivors treated with TSH suppression therapy are consistent with previous studies that assessed the effect of TSH suppression therapy on the potential risk of long-term adverse CVD outcomes among patients with thyroid cancer (15, 27). Despite the high survival rate, thyroid cancer survivors’ risk of CVD events in the first 5 years after the cancer diagnosis suggests that evaluating, not only patient-specific risk factors, but also the consequences of the cancer diagnosis and its treatment, is important to improve the quality of life of thyroid cancer survivors.
Similar to the findings from a previous study (28), our study supports the findings that certain demographic characteristics of thyroid cancer survivors might have a considerable effect on cardiac and vascular adverse health outcomes. Schultz et al. (28) reported, in a cross-sectional survey of 518 thyroid cancer survivors, that 9.7% had developed CVD within 10 years of follow-up and that men were more likely to report cardiovascular effects compared with women (28, 29). In contrast, Kero et al. (6) found that thyroid cancer survivors did not have a significantly greater risk of developing CVD compared with sibling controls in a recent population-based cohort study of 1356 early-onset (diagnosis at <35 years of age) thyroid cancer survivors. However, our study findings have improved on these earlier reports, because our sample included almost 4000 thyroid cancer cases diagnosed in patients aged ≥18 years. Also, we used complete EMR data rather than patient self-report data.
Regarding the late effects of thyroid cancer treatment, several studies have assessed the potential adverse effects of postoperative chemotherapy, RAI therapy, and TSH suppressive therapy (7, 13–15, 18, 30). Previous findings suggested that RAI therapy might cause, not only short-term nonfatal complications such as dry eyes (10), gastrointestinal system disorders (31), and salivary dysfunction (32, 33), but also serious chronic complications, such as pulmonary fibrosis and permanent bone marrow suppression (8). Furthermore, long-term TSH suppressive therapy is known to predispose thyroid cancer survivors to skeletal conditions, including arthritis, osteoporosis, and bone mineral density loss (7, 13), and to increase their risk of chronic cardiovascular outcomes, including tachycardia and stroke volume decrease (10, 28, 31).
Among the known risks of long-term health problems related to prolonged cancer treatment, our findings of an increased CVD risk for patients with thyroid cancer who received TSH suppression therapy after thyroidectomy are in agreement with previous research conducted among thyroid cancer survivors (6, 13, 15, 18). Shargorodsky et al. (15) reported that postoperative levothyroxine treatment was significantly associated with large and small artery elasticity, also known as a proxy marker of CVD, and suggested that long-term TSH suppressive therapy might alter myocardial and vascular function impairment. Furthermore, Klein Hesselink et al. (18) reported that a lower TSH level is associated with increased cardiovascular mortality, with a risk of 3.08 (95% CI, 1.32 to 7.21) for each 10-fold decrease in the geometric mean TSH level. Iatrogenic hyperthyroidism or thyroid dysfunction has also been known to increase the risk of atrial fibrillation and subsequent embolic cerebrovascular accidents (34, 35). However, because our study had limited information on the use of TSH suppression therapy after surgery, further investigation is required to evaluate the late effect of postoperative TSH suppressive therapy exposure on CVD risk.
Although previous studies suggested mixed findings regarding the linkage between RAI and cerebrovascular disease (36–40), our findings suggest that thyroid cancer survivors who received radiation therapy after surgery have an increased risk of developing cerebrovascular disease within 1 to 5 years after the cancer diagnosis compared with those who only underwent surgery. When we compared the role of different types of radiation therapy on cerebrovascular disease, although the difference was marginally significant statistically, postoperative RAI usage was the only subtype with an elevated risk of developing cerebrovascular disease. This association is biologically plausible, because the carotid arteries are located immediately adjacent to the thyroid gland and carotid artery intimal thickening has been reported after RAI for benign disease (41–43). However, given that we did not have dosage information, we were unable to evaluate dose-dependent relationships in our study population. The most commonly used dosage of RAI during the study period ranged from 30 mCi for remnant ablation to 100 to 150 mCi for therapeutic ablation of locoregional and extensive disease. Interinstitution and practitioner variation of activities also ranged from 30 to 150 mCi. Based on these practice patterns, we estimated that ~50% of subjects had likely been treated with 30 mCi and the rest with higher dosages. A rigorous investigation is needed to assess the role of RAI after surgery on long-term circulatory system disorders among thyroid cancer survivors.
We observed that patients with thyroid cancer with a diagnosis from 2005 to 2009 and 2010 to 2012 had an increased risk of CVD compared with the patients with a diagnosis from 1997 to 1999. One possible explanation for these associations might be the increasing proportion of patients who underwent TSH suppression (P < 0.0001) and radiation therapy (P = 0.0047) during the study period owing to changes in treatment strategies. Future investigation is necessary on the changes in clinical practices and long-term cardiac and circulatory conditions among thyroid cancer survivors.
The strengths of our study included the large population-based sample and assessment of information on cancer treatment from the EMRs. The cohort consisted of nearly 4000 thyroid cancer survivors, allowing us to study CVD morbidity associated with demographic characteristics and cancer treatment among thyroid cancer survivors. Furthermore, although previous studies relied on self-reported survey data, we used EMRs collected from two of the largest medical care providers in Utah and the hospital discharge/ambulatory surgery records.
Our study had several limitations. First, although the state of Utah is becoming more diverse, our study population was still predominantly white. Thus, the findings from our study might not be generalizable to other more diverse populations. Another limitation of our study was the use of ICD-9-CM codes and medical records for the disease diagnoses. We could not exclude the possibility of measurement and/or coding errors. Additionally, we did not have more detailed treatment-related information such as the types of TSH suppression therapy or the RAI treatment, dose, and frequency used, which would have allowed us further understanding of how various forms of cancer treatment might affect CVD risk among thyroid cancer survivors. Also, we were unable to assess other important potential cofounders (i.e., physical activity, diet). Hence, further investigation is clearly needed of the interplay among cancer treatment, demographic traits, lifestyle, and comorbidity clusters.
To the best of our knowledge, the present study was one of the first population-based studies to assess the association between the potential risk factors for CVD among thyroid cancer survivors. Year and age at cancer diagnosis, sex, cancer stage, TSH suppression therapy, baseline BMI, and baseline comorbidity were statistically significant risk factors for CVD. Our findings suggest that examining the effect of thyroid cancer diagnosis, cancer treatment, and demographic and psychosocial characteristics on the risk of life-threatening conditions is critical. Thus, for a better quality of life among thyroid cancer survivors, future research is needed to demonstrate the long-term health effects after the cancer diagnosis, not only to provide individualized clinical intervention, but also to prevent the risk of fatal conditions.
Abbreviations:
- BMI
body mass index
- CCI
Charlson comorbidity index
- CCS
Clinical Classification Software
- CVD
cardiovascular disease
- EMR
electronic medical record
- HR
hazard ratio
- RAI
radioactive iodine
- UPDB
Utah population database
Acknowledgments
We thank the Pedigree and Population Resource of the Huntsman Cancer Institute, University of Utah (funded in part by the Huntsman Cancer Foundation) for its role in the ongoing collection, maintenance, and support of the UPDB. We also thank the University of Utah Center for Clinical and Translational Science (funded by National Institutes of Health Clinical and Translational Science Awards), and the Pedigree and Population Resource, University of Utah Information Technology Services and Biomedical Informatics Core for establishing the Master Subject Index between the UPDB, the University of Utah Health Sciences Center, and Intermountain Healthcare.
Financial Support: The present study was supported by the National Institutes of Health (Grants R21 CA185811 and R03 CA159357; to M.H., primary investigator), the Huntsman Cancer Institute, Cancer Control and Population Sciences Program (HCI Cancer Center Support Grant P30CA042014), and the National Center for Research Resources grant, “Sharing Statewide Health Data for Genetic Research” (Grant R01 RR021746; to G.M., primary investigator), with additional support from the Utah State Department of Health and the University of Utah.
Disclosure Summary: The authors have nothing to disclose.
References
NCCN Clinical Practice Guidelines in Oncology. Thyroid Carcinoma. 2017. Available at: www.nccn.org/professionals/physician_gls/pdf/thyroid.pdf. Accessed 29 November 2017.
Healthcare Cost and Utilization Project. The HCUP Clinical Classifications Software (CCS). Available at: www.hcup-us.ahrq.gov/toolssoftware/ccs/ccs.jsp. Accessed 27 April 2017.
